Dashboard Overview
Audience: Store owners, marketing managers, and growth teams.
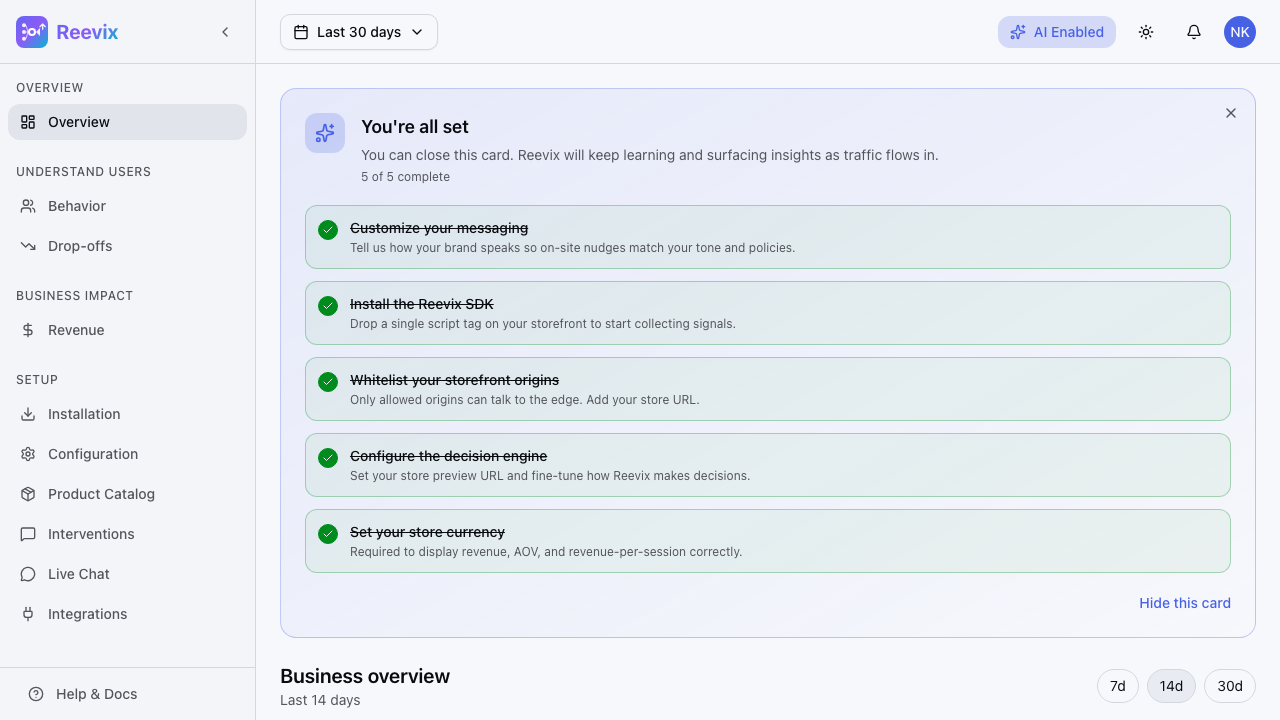
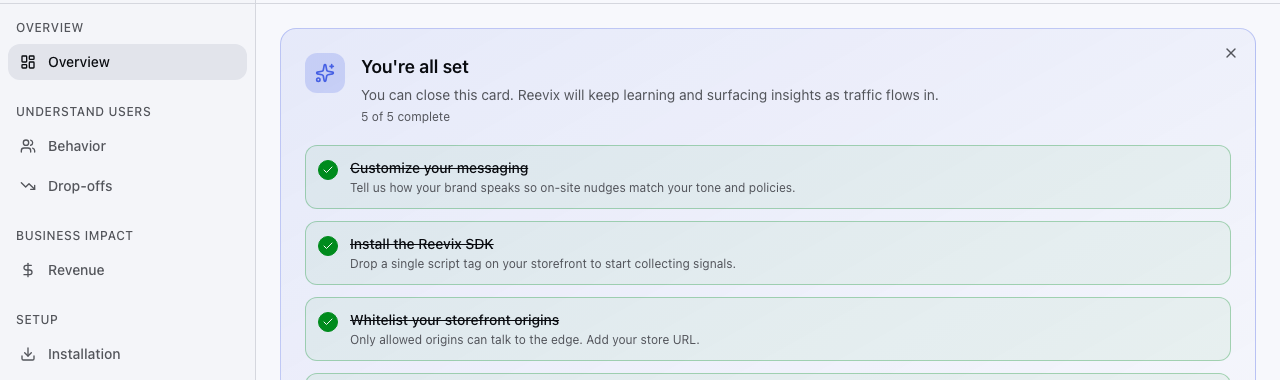
The Reevix dashboard is your command centre. It gives you a real-time pulse on store performance — from conversion rates and revenue to live shopper signals — all in one place.
The KPI Cards
The top row shows four headline metrics for your selected time period (7, 14, or 30 days):
| Metric | What It Means | Why It Matters |
|---|---|---|
| Conversion Rate | Percentage of sessions that resulted in a purchase | Your primary health indicator |
| Revenue | Total revenue attributed to Reevix-influenced sessions | Shows direct financial impact |
| Average Order Value (AOV) | Mean spend per completed order | Tracks upsell and cross-sell effectiveness |
| Revenue Per Session | Revenue ÷ total sessions | Measures how efficiently traffic converts to money |
Each card shows the current period value alongside a trend arrow comparing it to the prior period. A green upward arrow is good; a red downward arrow signals a drop worth investigating.
Configuring the Date Range
Click the 7D / 14D / 30D pill buttons in the top-right of the dashboard to switch between time windows. Reevix recalculates all metrics instantly — no page reload.
Shopper Signals Panel
Below the KPI cards, Reevix surfaces five real-time behavioural signals collected from your shoppers:

| Signal | What It Measures |
|---|---|
| Rage Click Rate | % of sessions with 3+ rapid clicks on a non-interactive element — a frustration indicator |
| Form Friction Rate | % of sessions with repeated failed form interactions (checkout, search) |
| Exit-Intent Rate | % of sessions where the visitor showed strong exit signals before leaving |
| Deep-Scroll Rate | % of sessions where the visitor scrolled past 75% of a page — a strong interest signal |
| Avg. Dwell Time | Mean time visitors spend on product and category pages |
AI Insight Bullets
Beneath the signals panel, Reevix generates plain-language AI observations based on current signal patterns. For example:
"Exit-intent rate is elevated on product pages — consider adding a shipping reassurance message."
These bullets update daily. They are not recommendations you need to act on manually — the autopilot already acts on these patterns automatically. They are surfaced here to give you context.
Reading the Dashboard — A Practical Walk-Through
Scenario: Conversion rate dropped 2% this week.
- Check the Exit-Intent Rate signal — if it spiked, shoppers may be leaving due to price or trust concerns
- Check Form Friction Rate — a spike suggests checkout issues (e.g., payment form errors)
- Jump to Drop-offs to see which funnel step has the biggest fall-off
- Check Revenue to see if revenue dropped proportionally or stayed stable (a stable revenue drop with falling CVR means AOV rose)
Multi-Store Switching
If your Reevix account manages multiple stores (e.g., a UK store and a US store), use the store selector in the top navigation bar to switch context. All dashboard metrics immediately update to show data for the selected store.
Tip: Bookmark the dashboard URL for your primary store — Reevix persists your store selection across sessions.