Shopper Behavior & Intent Analytics
Audience: Marketing managers, UX teams, growth analysts.
The Behavior page shows how your shoppers are distributed across five real-time intent states — and how that mix is trending over time. Understanding this is the key to diagnosing conversion problems before they show up in your revenue numbers.
The Five Behavioral States
Reevix classifies every session into one of five states based on continuous behavioural signals:

| State | What It Looks Like | Typical Conversion Rate |
|---|---|---|
| Exploring | Visiting many categories, spending little time per page, no deep engagement | Very low (0–1%) |
| Comparing | Viewing 3+ similar products, switching between product pages | Low (1–3%) |
| Evaluating | Focused on 1–2 products, reading reviews, scrolling images repeatedly | Medium (5–15%) |
| Ready | High cart value, hovering Add to Cart, fast scroll through checkout page | High (20–40%) |
| Buying | In cart or checkout flow | Very high (30–60%) |
The bar/donut chart at the top shows the distribution across all sessions for your selected period.
What a Healthy Mix Looks Like
A healthy store has a funnel shape: many Exploring sessions, fewer Comparing and Evaluating, fewer still Ready and Buying. If your distribution is flat — many Exploring but very few Ready — it suggests your product pages are not providing enough information to move shoppers forward.
Trend Charts
Below the state distribution, Reevix shows a trend chart for each state over your selected time window. Use these to spot:
- Comparing spike — Could indicate a competitor pricing event pulling shoppers into research mode
- Ready state drop — Could indicate a trust issue (e.g., removed a key trust badge) or pricing change
- Buying state drop without revenue drop — Could indicate your checkout page loaded slowly on certain dates
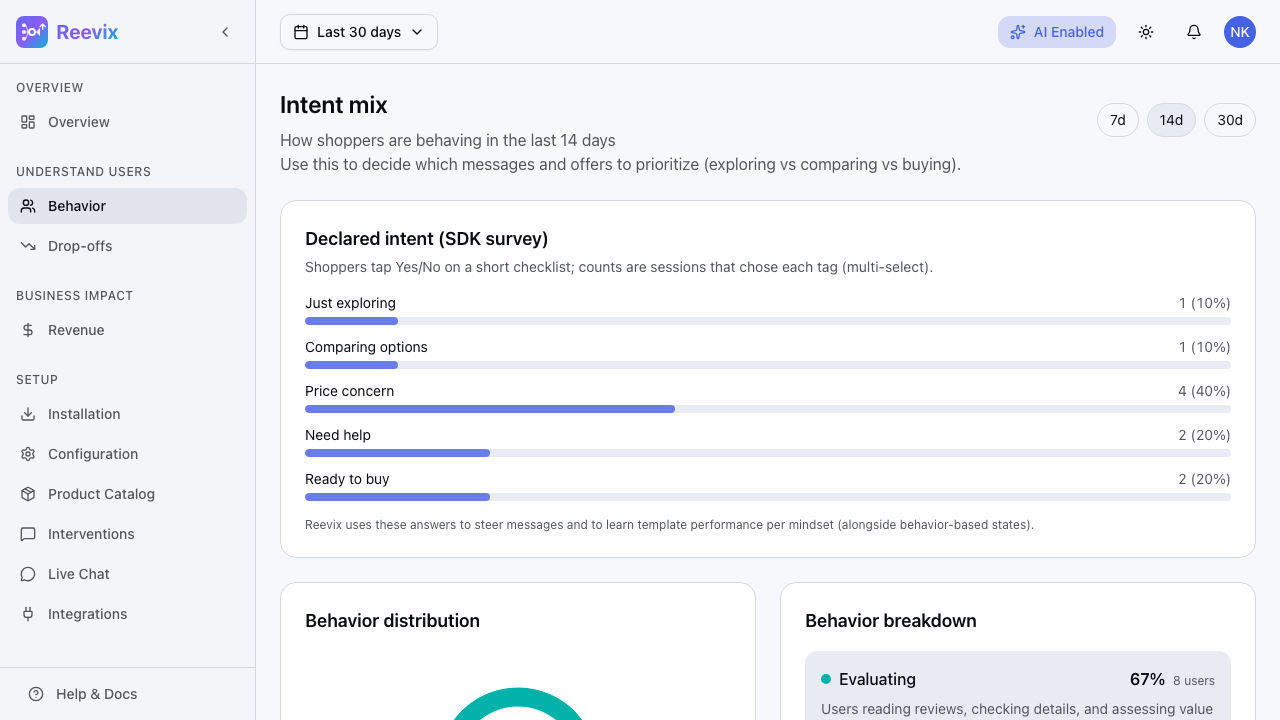
Declared Intent (Survey Data)
Alongside behavioral classification, Reevix runs a micro-survey that asks visitors "What brings you here today?"
The five options map to behavioral states:
| Survey Answer | Behavioral Signal |
|---|---|
| Just exploring | Confirms Exploring state |
| Comparing options | Confirms Comparing state |
| Price is a concern | Flags price-sensitive Evaluating visitor |
| Need help deciding | Flags undecided Evaluating visitor; triggers chat |
| Ready to buy | Confirms Ready or Buying state |
Survey responses appear in the Behavior page as a secondary breakdown, letting you compare observed behaviour with declared intent. When they diverge, it often reveals a conversion opportunity.
Example: 30% of visitors declare "Ready to buy" but only 8% are in the Buying state. This gap suggests checkout friction is the problem — not intent.
Configuring the Survey
The survey fires automatically when Reevix detects one of these signals:
- Scrolled for 8+ seconds without clicking
- Rage-clicked 3+ times
- Cursor moved toward the browser close button
- Idle for 25+ seconds
It appears at most once per session. You cannot suppress the survey from the dashboard — it is a core signal-collection mechanism. If you want to disable it, contact support.
Using Behavior Data to Drive Action
| Observation | What to Do |
|---|---|
| High Comparing, low Evaluating | Add comparison tables, better filtering, or "most popular" social proof |
| High Evaluating, low Ready | Add trust signals: reviews, return policy badge, money-back guarantee |
| High Ready, low Buying | Investigate checkout friction; check the Drop-offs page |
| Exploring spike with no Comparing follow-through | Check that your category pages have good internal search and navigation |
The autopilot already acts on these patterns automatically — but these observations help you make product and UX decisions that the autopilot cannot make for you.