Revenue Impact
Audience: Store owners, finance teams, and growth managers tracking Reevix's ROI.
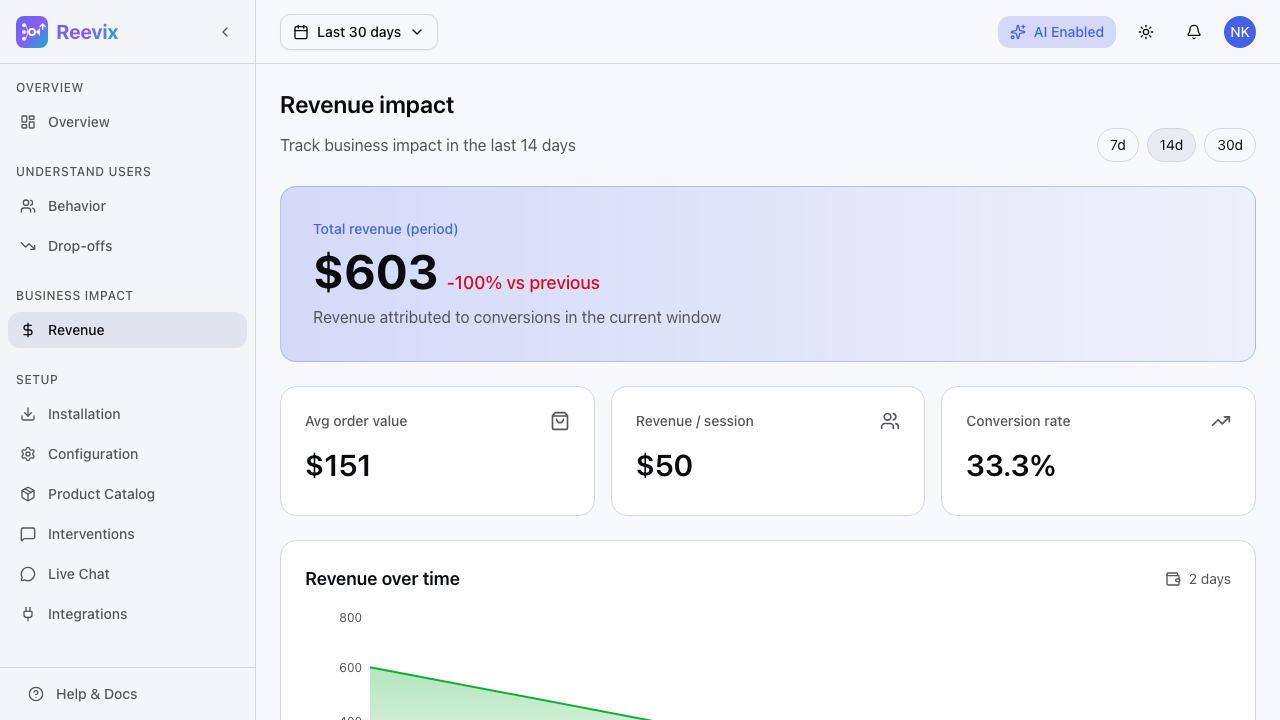
The Revenue page shows the direct financial impact of Reevix on your store. It breaks down total attributed revenue, per-intervention-type contribution, traffic source performance, and key monetisation metrics.
Revenue Attribution

Reevix attributes revenue to sessions where at least one autopilot intervention was shown and the session resulted in a purchase. The page shows:
- Attributed Revenue — total revenue from influenced sessions for the selected period
- Revenue Trend — a daily chart showing attributed revenue over time
How Attribution Works
Reevix uses a session-level last-touch model:
- A visitor arrives on your site
- Reevix shows them a text nudge (e.g., "Free returns within 30 days")
- The visitor adds to cart and completes checkout
- The purchase is attributed to Reevix
If no intervention was shown, the purchase is not attributed (it would have happened anyway). This keeps your Reevix revenue number conservative and accurate.
Revenue Trend Chart
The trend chart shows daily attributed revenue for your selected period. Use it to:
- Correlate with marketing campaigns — Did revenue spike after a flash sale? The chart will show whether Reevix interventions contributed to the lift.
- Detect autopilot regressions — A revenue drop without a traffic drop suggests intervention performance fell (e.g., after regenerating templates with weaker copy).
- Compare periods — The chart shows the prior period as a ghost line for direct comparison.
Switching Time Windows
Use the 7D / 14D / 30D pills to change the chart range. All metrics update simultaneously.
Intervention Breakdown
Below the trend chart, Reevix shows revenue contribution by intervention type:
| Intervention | What It Is | Example |
|---|---|---|
| Text nudge | A small pop-in message shown on product or cart pages | "Free returns within 30 days" |
| Highlight | Draws attention to existing trust badges or content | Pulsing a review section |
| Reorder | Rearranges page elements to surface persuasive content | Moving the guarantee badge above the fold |
| No action | Reevix observed the session but intentionally did not intervene | Low-intent visitors or already in Buying state |
The no-action category is shown to demonstrate that the autopilot is calibrated — it does not over-message visitors who don't need a nudge.
Traffic Source Performance
Reevix breaks down conversion rate and revenue per session by UTM source:
| Source | Sessions | CVR | Revenue/Session |
|---|---|---|---|
| google / cpc | 4,200 | 3.8% | $2.14 |
| email / campaign | 1,100 | 8.2% | $5.33 |
| direct / none | 6,800 | 2.1% | $1.42 |
| instagram / social | 890 | 1.2% | $0.74 |
Use this to prioritize which acquisition channels to invest in — and to understand whether Reevix's interventions are particularly effective for specific sources.
Key Monetisation Metrics
At the bottom of the Revenue page:
| Metric | Description |
|---|---|
| Average Order Value (AOV) | Mean order value for attributed purchases |
| Revenue Per Session | Attributed revenue ÷ total sessions |
| Conversion Rate | Attributed purchases ÷ total sessions |
Setting Up Revenue Tracking
If the Revenue page shows "No revenue data yet", you need to add the convert event to your checkout confirmation page:
rvx('convert', {
  orderId: 'ord_789',
  total: 149.99,
  currency: 'USD',
  itemCount: 3,
})
The page will show a code snippet with your exact integration instructions if no data has been received. Add this event and revenue data will appear within the next session.
For Shopify stores: Reevix automatically listens for the checkout_completed web pixel event — no custom code required if you've added the snippet via the Shopify storefront.