Funnel & Drop-offs
Audience: Conversion rate optimisation teams, UX designers, and anyone diagnosing checkout abandonment.
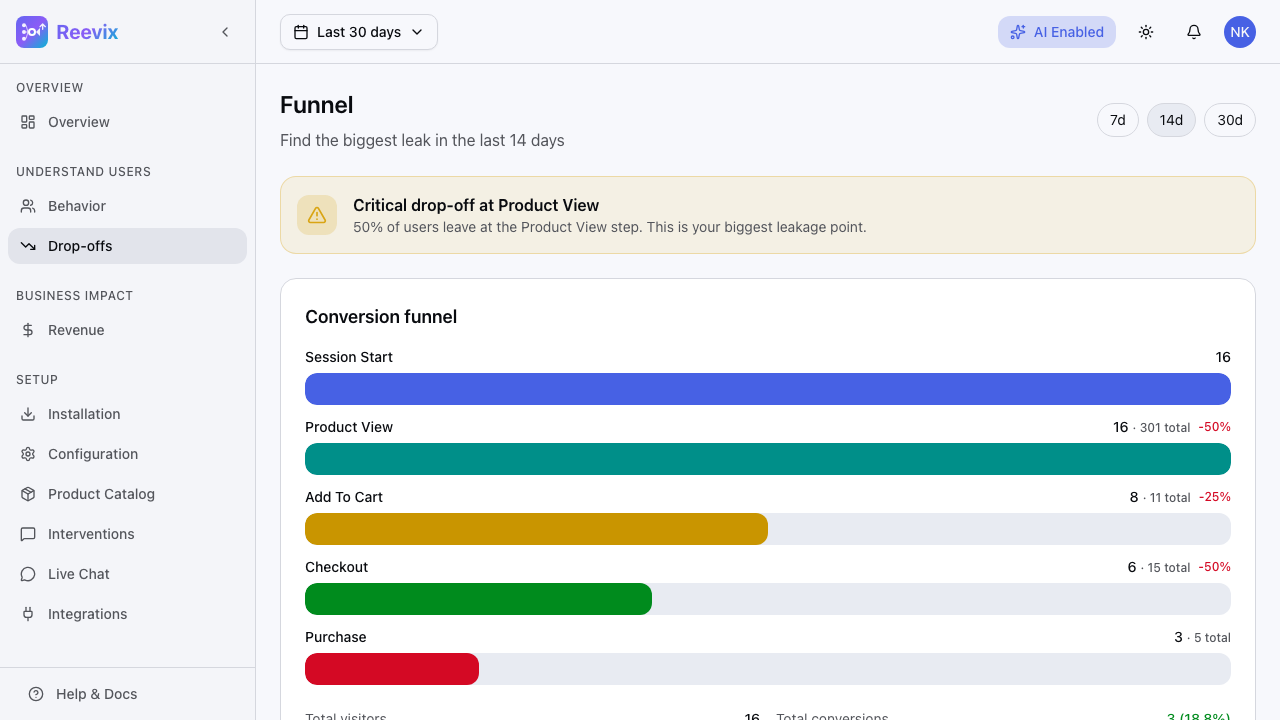
The Drop-offs page shows where visitors are abandoning your site across the four critical funnel stages — and assigns a severity rating to each gap so you know what to fix first.
The Conversion Funnel

Reevix tracks four standard funnel stages for every session:
| Stage | Counted When |
|---|---|
| Page View | Any page on your store is loaded |
| Add to Cart | A product is added to the shopping cart |
| Checkout Started | The visitor reaches the checkout page |
| Purchase | An order is completed |
The funnel shows the count of sessions reaching each stage and the drop-off percentage between each step.
Drop-off Severity Ratings
Each funnel step is assigned a severity rating based on the magnitude of the drop-off relative to industry benchmarks:
| Rating | Drop-off Threshold | What It Means |
|---|---|---|
| Critical | > 80% drop | Severe — this is likely your single largest conversion bottleneck |
| High | 60–80% drop | Significant — above average abandonment for this step |
| Medium | 40–60% drop | Normal for most stores — worth monitoring |
| Low | < 40% drop | Good — this step is performing well |
The banner at the top of the page auto-highlights your highest-severity bottleneck with a plain-language recommendation.
Understanding Each Drop-off Step
Step 1: Page View → Add to Cart
Benchmark: 80–90% of page views do NOT result in add-to-cart. This is normal.
High drop-off signals:
- Product pages lack sufficient trust signals (reviews, return policy, stock badges)
- Images are poor quality or slow to load
- Pricing is unclear or hidden until checkout
- The Add to Cart button is below the fold on mobile
Reevix interventions that help here:
- Text nudges surfacing return policy or shipping reassurance
- Highlighting social proof (review count, "500+ sold")
Step 2: Add to Cart → Checkout Started
Benchmark: 60–75% of add-to-cart sessions don't start checkout. Normal range.
High drop-off signals:
- Cart page shows unexpected fees (shipping, taxes) that weren't visible earlier
- No urgency or incentive to proceed
- The checkout CTA is not prominent
Reevix interventions that help here:
- Free shipping threshold nudge ("Add $12.50 to qualify for free shipping")
- BNPL reminder in cart
Step 3: Checkout Started → Purchase
Benchmark: 30–50% of checkout starts don't complete. This is the most impactful step.
High drop-off signals:
- Payment form errors or friction
- Required account creation
- No guest checkout option
- Too many form fields
- Unexpected shipping cost revealed at this step
Reevix interventions that help here:
- Money-back guarantee message shown during checkout
- Cart saver nudge if the visitor idles for 30+ seconds on the payment page
Plain-Language Insight Per Step
For each step, Reevix generates a two-sentence insight:
"71% of sessions that add to cart do not start checkout. This is above the 60% benchmark — consider showing a free shipping nudge in the cart to reduce friction."
These insights are generated daily based on your current funnel data.
Acting on Drop-off Data
Drop-off data tells you where the problem is, but not always why. Combine it with:
- Behavior page — Is a specific intent state over-represented in the drop-off cohort?
- Shopper signals — High form friction rate correlates strongly with checkout drop-off
- Session recordings (if you use a complementary tool like Hotjar) — Watch actual sessions dropping at the identified step
The autopilot addresses the most common causes of each drop-off automatically — but for structural issues (missing guest checkout, hidden fees), code or UX changes are needed that Reevix cannot make on its own.